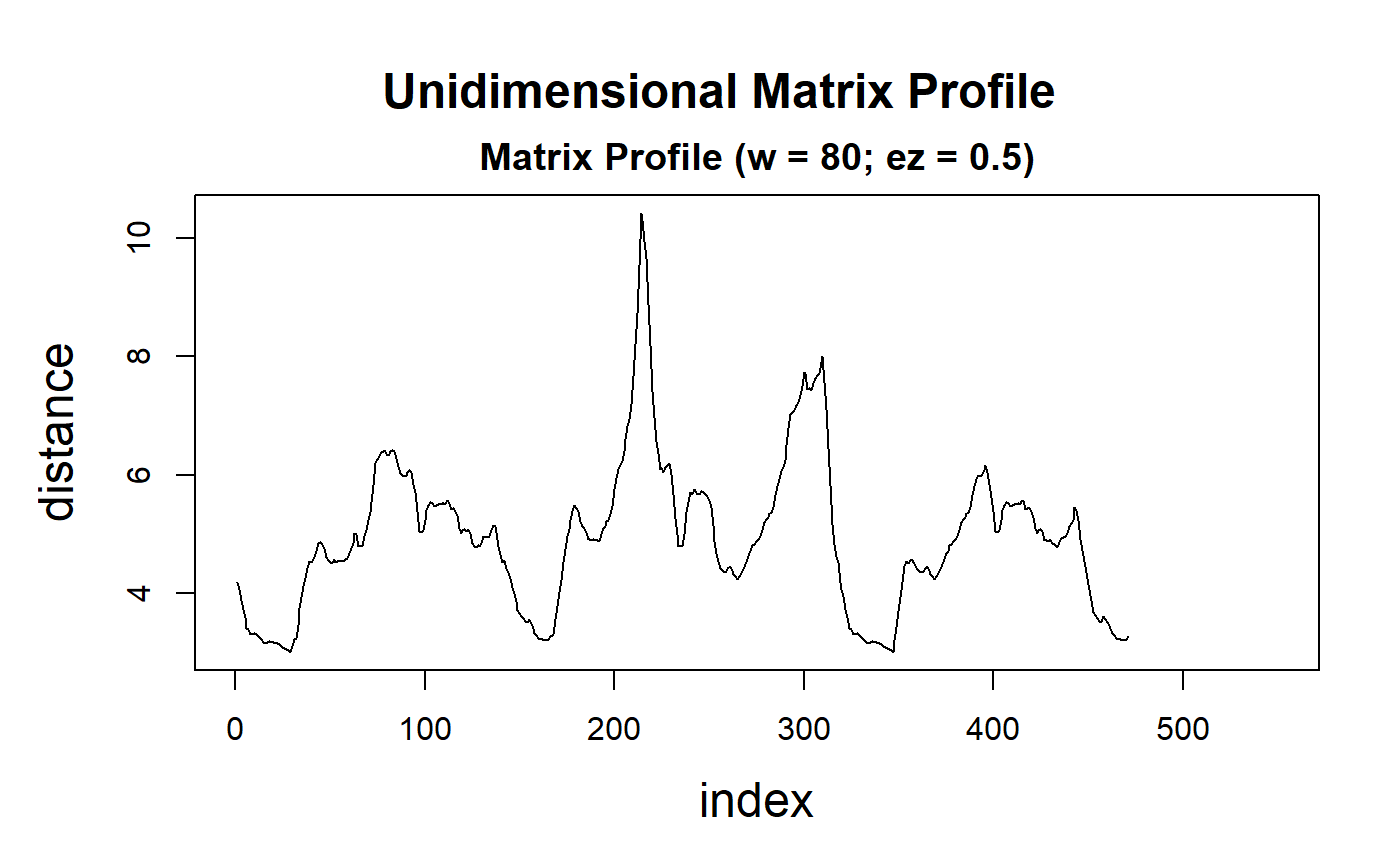
Plots an object generated from one of the algorithms. In some cases multiple plots will be generated
Source:R/visualize.R
visualize.RdPlots an object generated from one of the algorithms. In some cases multiple plots will be generated
visualize(profile)
Arguments
| profile | a |
|---|
References
Website: http://www.cs.ucr.edu/~eamonn/MatrixProfile.html